
Appearance
The Data tab
The Data tab holds the rows of your graph. A row says that something exists, or that two things are connected, or that a cluster begins or ends. What a row means depends on which cells you fill in, and the dot at the start of the row shows how the app has read it.
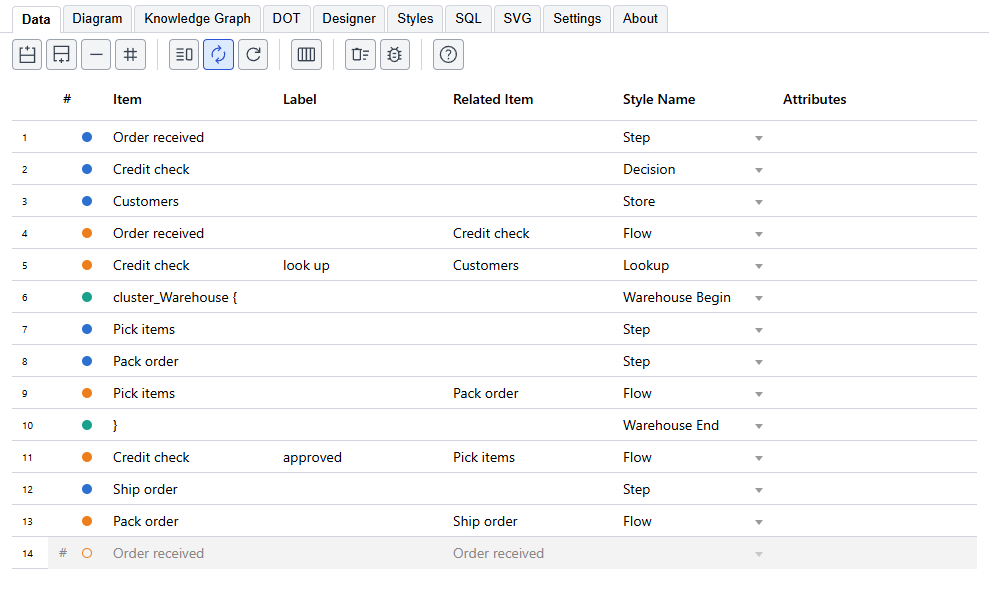
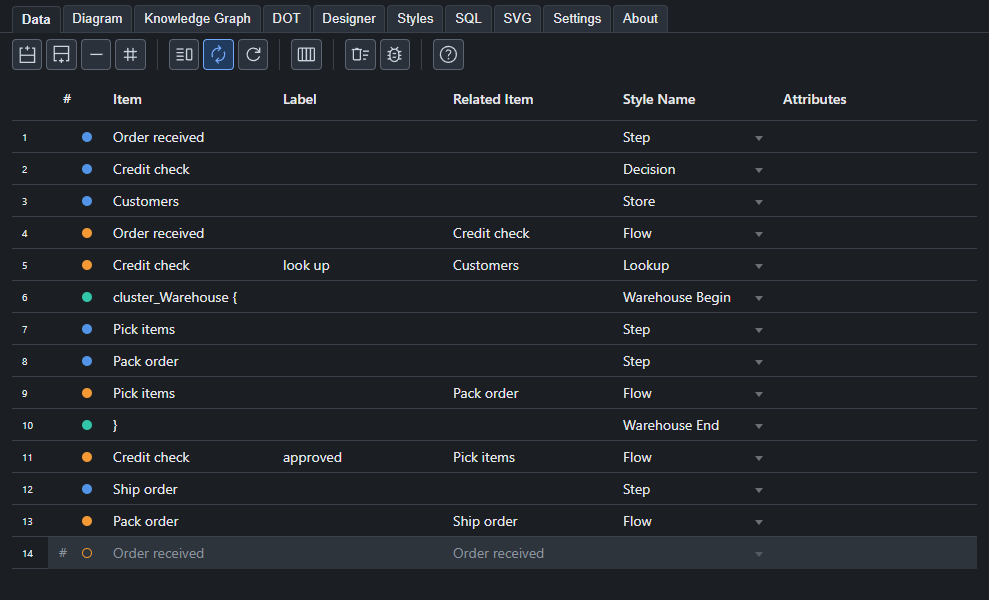
The kinds of row
| You fill in | The row is | The dot is |
|---|---|---|
| Item only | A node | Blue |
| Item and Related Item | An edge from the item to the related item | Orange |
An item that ends in {, such as cluster_Warehouse { | The start of a cluster | Teal |
An item that is } | The end of the innermost open cluster | Teal |
An item that is node, edge or graph | Default attributes for everything after it, in the same scope | Gray |
An item that is > | Raw DOT, written into the output exactly as you typed it in Label | Purple |
A dot that is a hollow red ring means the row names a style that does not exist. A row that is commented out shows its dot as a hollow ring too, and is left out of the graph.
Several at once
One row can hold several nodes: Packing, Shipping, Billing in Item makes three. A row with a list in Item, or in both Item and Related Item, makes an edge for every pairing, so a, b to c, d makes four edges.
Clusters
Open a cluster with a row whose item ends in {, and close it with a row whose item is }. Everything between the two is inside it, and clusters can be nested.
Graphviz draws a box only round a cluster whose name starts with cluster. If you name one Warehouse { the nodes are grouped, but there is no box; name it cluster_Warehouse { to get one. Put the cluster's own label and colors in a style, and choose that style in the Style Name cell of the row that opens it.
The columns
| Column | What goes in it |
|---|---|
| # | Click to comment the row out or back in. |
| (the dot) | Shows the kind of row. You cannot type in it. |
| Item | The node, or the start of an edge. |
| Label | The text drawn on the node or the edge. Leave it empty to use the item's name. |
| Related Item | The end of an edge. |
| Style Name | The style the row uses. The list holds the styles that suit the row: the node styles for a node, the edge styles for an edge, and so on. A row whose Item is node or edge sets the defaults for every node or every edge after it, so its list holds the node styles or the edge styles. A graph row is offered the keyword styles. |
| Attributes | Graphviz attributes for this row alone, such as color=red penwidth=2. They win over the style's. |
| Properties | Facts about the item that do not change the drawing but go into the Knowledge Graph, such as owner="Finance" tier=1. The pencil opens a small grid to edit them. |
Tail Label, External Label, Head Label and Tooltip are also there, and a new project hides them. The columns button on the toolbar shows or hides any column, and the choice is saved with the project.
A style's label can use {label}, {xlabel}, {taillabel} and {headlabel}, and the row's values are put in their places.
Editing
- Type in a cell, or paste rows copied from Excel or another grid. Several cells paste at once.
- Drag the small handle at the corner of the chosen cell to fill down.
- Undo and Redo in the left pane step through your changes, including a paste or a fill.
- The row buttons add a row above or below, remove the chosen rows, and comment them out or back in. Choose several rows and Add row above or Add row below adds as many rows as you chose, the way Delete rows removes as many.
- Drag the edge of a column's heading to change the width of the column. The widths are saved with the project, and each of the Data, Styles and SQL tabs keeps its own. Reset widths, in the menu of the columns button, puts the columns of that tab back to their usual widths.
- Clear data (the trash can with sweep lines) removes every row and keeps your styles. A new project starts with a few empty rows to type into.
Seeing the graph
The button with the split window on the toolbar shows the diagram beside the data, so that you see it change as you type, and hides it again when you want the whole width for the data. The diagram is always on the Diagram tab as well. The button beside it, with the arrows going round, draws after every change, and the button after that draws once.
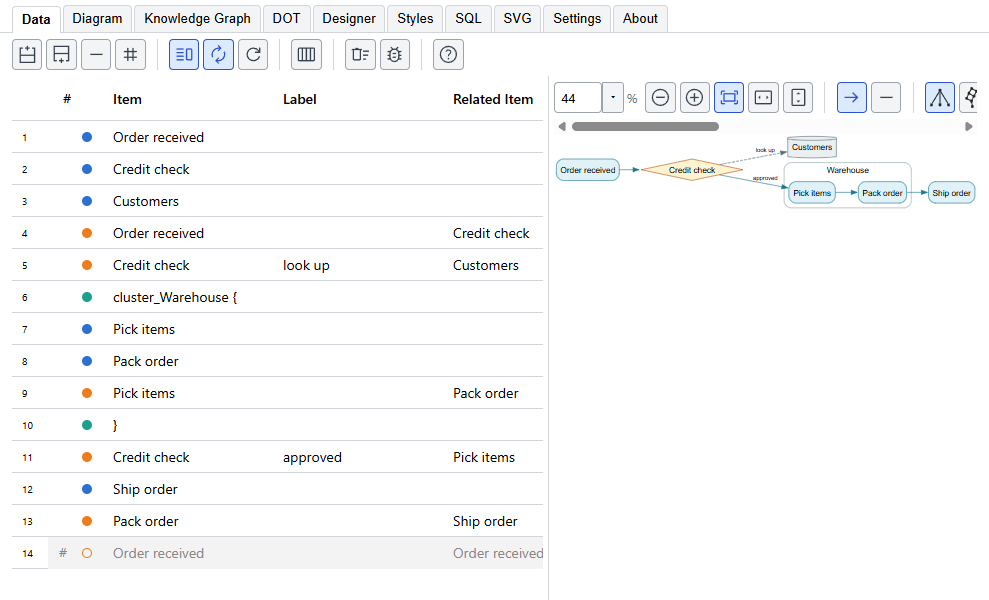
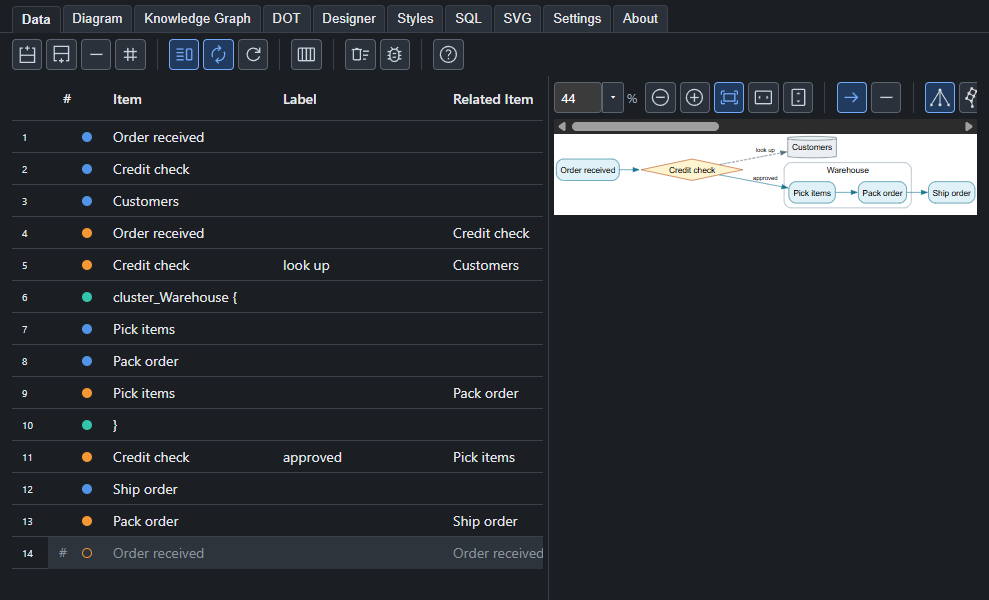
The line between the data and the diagram can be dragged to give either more room, which helps on a small screen, and a double-click puts it back in its usual place. With the line selected, the left and right arrow keys move it, Home and End take it to its limits, and Enter puts it back. Where you left it is saved with the project.
The toolbar
From left to right: the row buttons; the diagram buttons (show it beside the data, draw after every change, draw now); the columns button, which shows or hides columns and resets their widths, and the wrap button where a column can wrap; then the buttons that are used least, Clear data and the bug. The bug button adds each row's number to its label, which is a quick way to find the row behind something odd in the picture. Clear data removes every row and keeps your styles, and it is at the far end so that it is not pressed by mistake.