
Appearance
Getting started
This takes a few minutes and ends with a graph on screen and a file you have written. You need Graph Modeler, and Graphviz if you want to see the picture. Everything before the picture works without it.
1. Start a project
Open the app. It starts with a new project: a few empty rows on the Data tab, and the styles every project has.
The left pane has the project's name and the buttons for New, Open, Save and Save as, then Undo and Redo, then Publish. A project is saved as a .json file.
2. Type the things
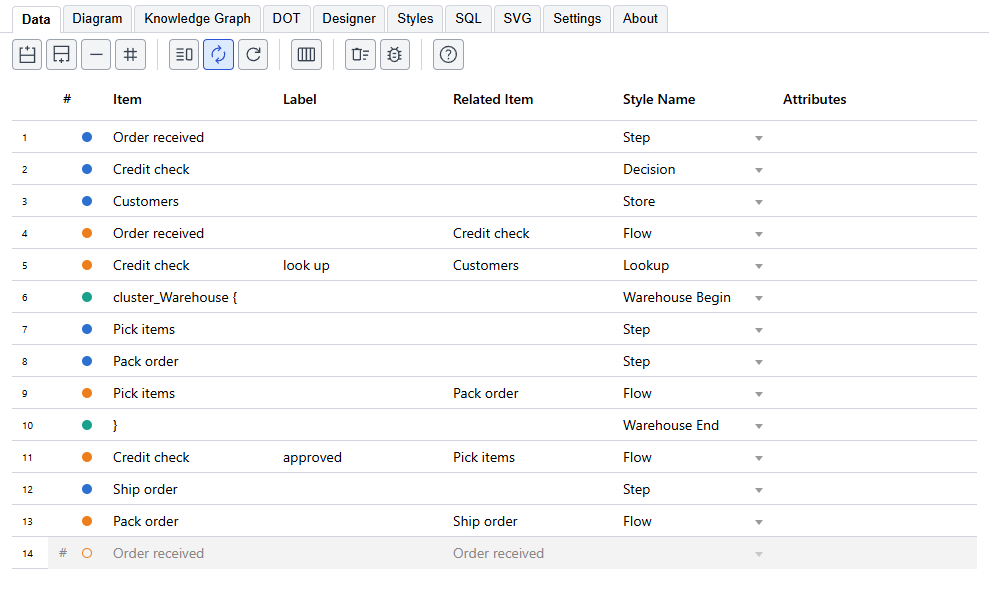
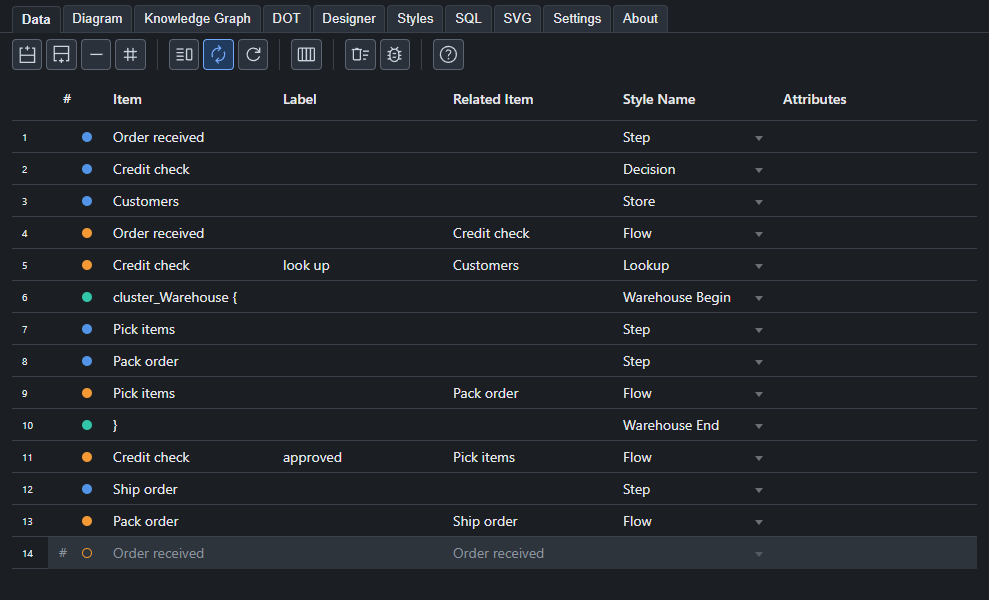
On the Data tab, type a name in the Item column of the first row: Order received. That is a node. Move to the next row and type Credit check, and then Ship order on the one after. Each is a node, and each row has a blue dot.
To connect two of them, put one in Item and the other in Related Item. A row with Order received and Credit check is an edge from the first to the second. Its dot is orange. Add Credit check to Ship order the same way.
The diagram appears beside the data, so you see it change as you type. If you do not see a picture, see Without Graphviz. The button with the split window on the toolbar hides it, to give the data the whole width, and the diagram is always on the Diagram tab.
3. Give them a look
Every node and edge so far uses the plain default style, so all of them look alike. A style changes that.
- Open the Designer tab and choose Node.
- Pick a shape, say a rounded box, and a fill color. The preview changes as you choose.
- Type
Stepas the Style name and press Save to styles. - Back on the Data tab, type
Stepin the Style Name cell of the node rows, or choose it from the list.
Every row that uses Step follows it. Change the style again and they change together. See the Designer and the Styles tab.
4. Say what they mean
A style says how a thing looks. It can also say what it is, and that is what the Knowledge Graph carries.
- On the Styles tab, click the Format cell of
Stepand press the pencil, which opens the style in the Designer. - Type a Description, such as
A step in the process. - Press the pencil beside Properties and add a property or two: a Name such as
ownerand a Value such as"Fulfillment team". A bare number ortrueis read as a number or a true/false value, and a value in quotes is text. - Press Save to styles.
Nothing in the picture changes. Open the Knowledge Graph tab and the style is there with its description and properties. See the Designer.
5. Lay it out
Open the Diagram tab. The buttons above the picture change the layout: left to right is easier to read for a process, and the layout engines place nodes in different ways. Try a few. See the Diagram tab.
6. Publish it
In the left pane, under Publish:
- Choose the folder the files go to. It starts as the folder of the project file, or your Documents folder if the project is not saved yet.
- Type a file name. A preview shows what the next file will be called.
- Under Write, turn on what you want: the diagram, the Knowledge Graph, the DOT source, or any mix.
- Choose Add to the name: nothing, the date and time, or a counter. A counter makes each publish a new file instead of replacing the last.
Press Publish, and the files written are listed. The pane is described on its own page. Click one to open it. Publish all views writes a set for every view.
The diagram can be an SVG, a PNG, a PDF and more; the format is set under Settings. The Knowledge Graph is a JSON file, described in the Knowledge Graph tab.
7. Save the project
Save writes the project to a .json file. Open it again later and your rows, styles and settings are back. The file is plain text, which you can read, keep under version control, or generate from another program.
Next
- Build the rows from a spreadsheet instead of typing them: the SQL tab.
- Turn on colors for kinds of things by giving each kind its own style, and use views for an overview and a detailed picture from the same rows.
- Hand your graph to an AI tool with the Knowledge Graph.