
Appearance
The Designer
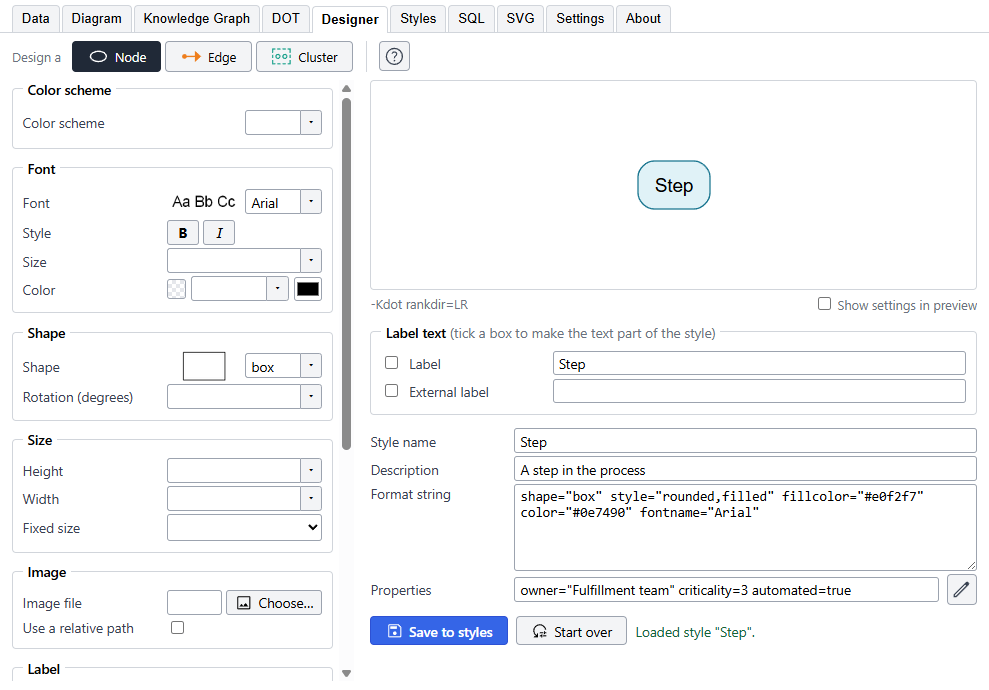
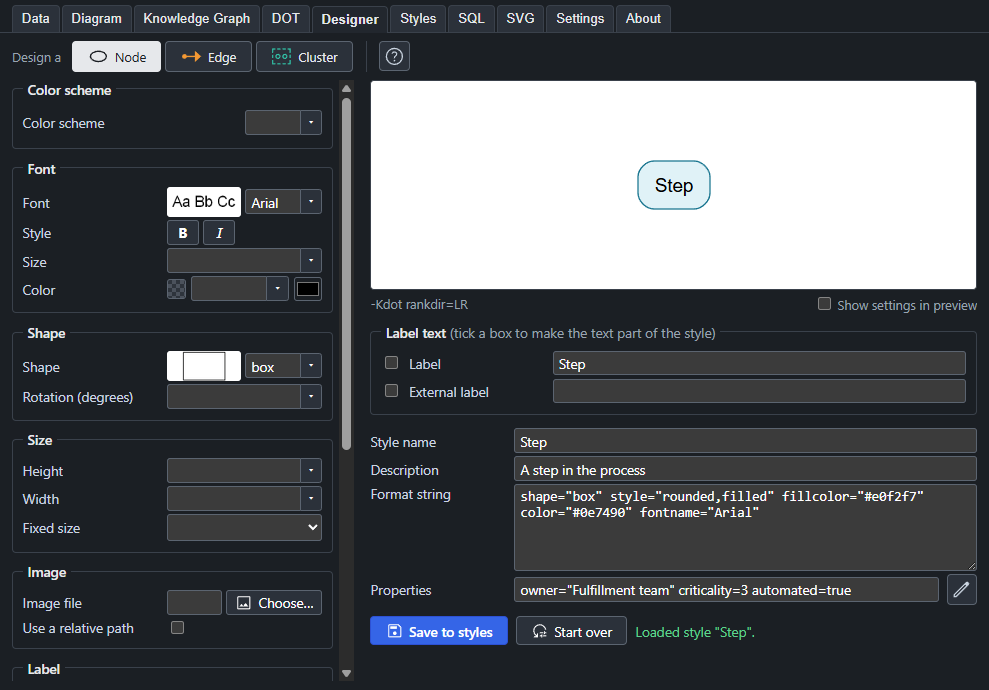
A style is a name and a format, and the format is a list of Graphviz attributes such as shape="box" and fillcolor="#e0f2f7". You can type a format into the Styles tab, but you need to know the attribute names and what values they take. The Designer lets you choose them from menus, shows the result as you go, and writes the format for you. It also holds the Description and the Properties of a style, which do not change the drawing but travel with the style into the Knowledge Graph.
Using it
- Choose what you are designing with Node, Edge or Cluster at the top, each with a small picture of what it is. Only the choices that apply to it are shown.
- Pick values on the left. The preview on the right is drawn by Graphviz after every change, and the Format string below it shows what is being written.
- Give the style a Style name. A Description and Properties say what the style means, for the Knowledge Graph; see Description and properties.
- Press Save to styles. The style is added to the Styles tab, or updated if one of that name is there.
To change a style you already have, click its Format cell on the Styles tab and press the pencil that appears in the cell. The Designer opens with that style loaded. Start over clears everything.
The Designer knows the attributes it offers. If a format has others, they are kept in the format string and written back unchanged, and you can add your own by typing in the format string.
What you can set
The choices are in groups, and the ones that do not apply to what you are designing are left out.
- Color scheme, Font, Shape, Size, Image, Label, Fill and Border for nodes and clusters, with their edge counterparts, such as arrowheads, for edges.
- Colors take a name or a hex value, with a swatch and a picker. A Color scheme makes the color names in the list read from a set, such as one of the ColorBrewer palettes, so a diagram can use a palette from one choice.
- Shape and Font show a small picture of each choice in their lists. The fonts are the ones installed on your computer; see Fonts for how they are found and what to do after installing one.
- Height and Width take a length in the unit of the project, inches or millimeters, which is set under Settings. See Units and packing.
- Head port and Tail port show a picture of each choice: a circle for the node and an arrow that arrives at, or leaves from, one of its compass points. They are listed clockwise from north, then the center, and the default,
_, leaves the choice to Graphviz. - Packing (osage layout) is offered for a cluster when the layout is osage. See Units and packing.
- Position choices, such as where a label sits in a cluster, are buttons with an icon: vertical position first, then horizontal. A second press on the chosen button clears it.
The tick boxes under Label text decide whether the text typed there becomes part of the style, or is only used to draw the preview.
Show settings in preview adds the format to the preview as a caption, which is useful for a picture that shows how a style was made.
For the meaning of each attribute, see Graphviz's own pages on attributes.
Description and properties
A style says how something looks, and it can also say what it is. Under the preview, beside the Style name, are a Description and Properties. Neither changes how anything is drawn. Both go into every Knowledge Graph that uses the style, so a program or an AI tool that reads the file learns what a Step is without having to see the picture.
- Description is a sentence about the kind of thing the style stands for, such as "A step in the process" or "Somewhere data is kept". It is also the Description column of the Styles tab.
- Properties are facts that go with every node, edge or cluster of the style: who owns that kind of thing, how critical it is, which system it lives in. The box shows them as
name=valuepairs. Press the pencil beside it to open Properties of style "Step", a small grid with a line for each property.
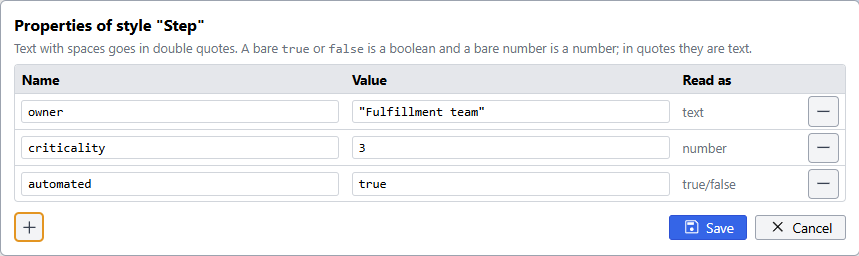
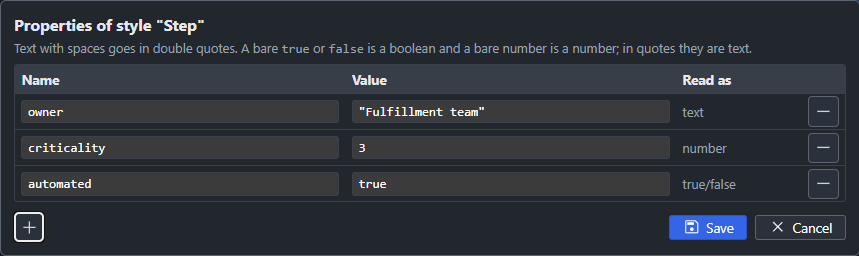
Each line has a Name, a Value, and Read as, which says how the value will be written into the Knowledge Graph. The plus button adds a line and the minus button at the end of a line removes it. Save keeps the changes in the style, and Cancel leaves it as it was. The way a value is typed decides how it is read:
| You type | Read as | In the Knowledge Graph |
|---|---|---|
"Fulfillment team" | text | "Fulfillment team" |
3 | number | 3 |
true | true/false | true |
"3" | text | "3" |
Text with spaces goes in double quotes. A bare number is a number, and a bare true or false is a true/false value; the same words in quotes are text. So criticality=3 lets a program add up and compare, where criticality="3" does not.
The style above comes out in the Knowledge Graph like this:
json
"Step": {
  "description": "A step in the process",
  "type": "node",
  "properties": { "owner": "Fulfillment team", "criticality": 3, "automated": true }
}
Press Save to styles to write the Description and the Properties along with the format. A row on the Data tab can have properties of its own, in its Properties column. Those belong to that one node or edge, and the style's belong to every one of that style.
Pictures in nodes
A node can show a picture with the Image group. Choose the file, or give a name that is found beside the project file or in the image path set under Settings.
When the node is bigger than its picture, the format decides how the picture fills the space, and how it looks depends on the output format. This comes from Graphviz, not from the app:
- In SVG, which the Designer and the Diagram tab show, a picture keeps its proportions. It is fitted inside its box, not stretched, and set at the top left.
- In PNG, PDF and the other drawn formats, the picture is scaled to fill the box. A square picture in a wide node is stretched across it, whatever the image scaling is set to, unless it is set to scale both ways together (
true).
So a graph that looks right on screen can show a stretched picture when it is published as a PNG. To have the same picture in every format, scale both ways together, or give the node the shape of the picture. If in doubt, publish a PNG and open it.