
Appearance
The DOT tab
DOT is the text Graphviz reads. Graph Modeler writes it from your rows and styles, and the DOT tab shows it as it will be sent to Graphviz. You never have to write DOT yourself, but reading it is the quickest way to see exactly what a setting or a style does.
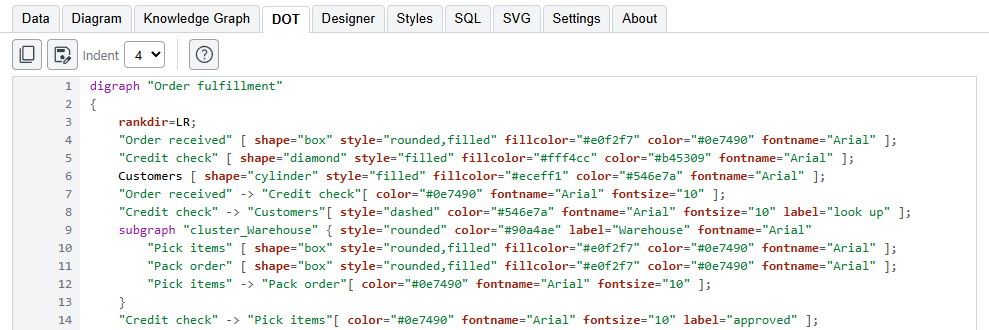
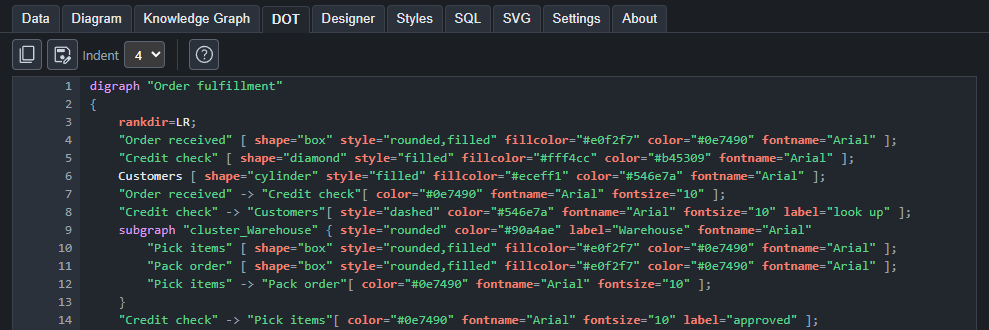
The text is colored to be read: keywords such as digraph and subgraph, attribute names, quoted strings, numbers, arrows and comments each have a color. A very large graph, of more than half a million characters, is shown without color so that the tab stays quick.
The buttons
- Copy puts the whole text on the clipboard.
- Save writes it to a
.gvfile of your choosing. - Indent sets how many spaces each level is indented by, from none to eight. It changes the text and not the graph.
The DOT file can also be written with Publish. Turn on the third Write button, the one with the angle brackets, in the left pane.
What is in it
- The graph's name, taken from the project's.
- The settings that are written into the graph itself, such as the direction, the output order and any extra options you typed in Settings.
- A node or edge for each row, with the attributes of its style and then of the row.
- A
subgraphfor each cluster, with the style of its opening row. - Any row you made with
>, written out exactly as you typed it.
Problems the app finds in the data are listed in the left pane.
Using it elsewhere
The text is ordinary DOT. Paste it into any tool that reads Graphviz, run it with the dot command, or keep it with your documents. Graphviz's own pages explain the language, at graphviz.org.