
Appearance
The Knowledge Graph tab
The same rows and styles that make a diagram can also be published as a Knowledge Graph: a JSON file that lists the nodes, the edges and the styles, along with the properties you attached to them. It is meant to be read by programs, and by AI tools that you want to ask questions about your graph, since it states in words and values what a picture only shows.
It is made by the app itself and needs no Graphviz.
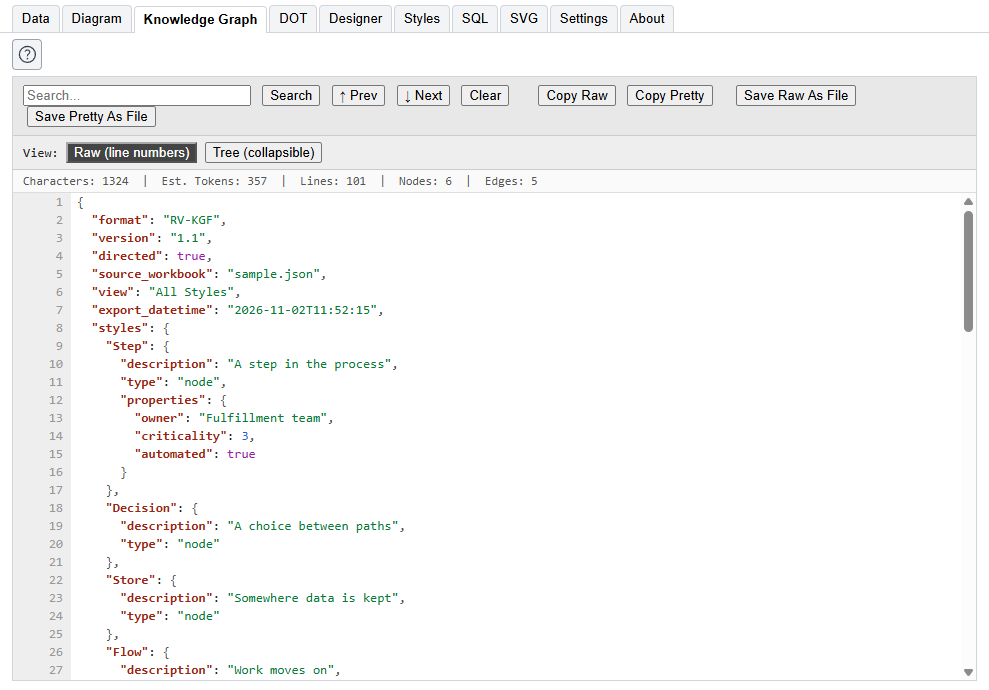
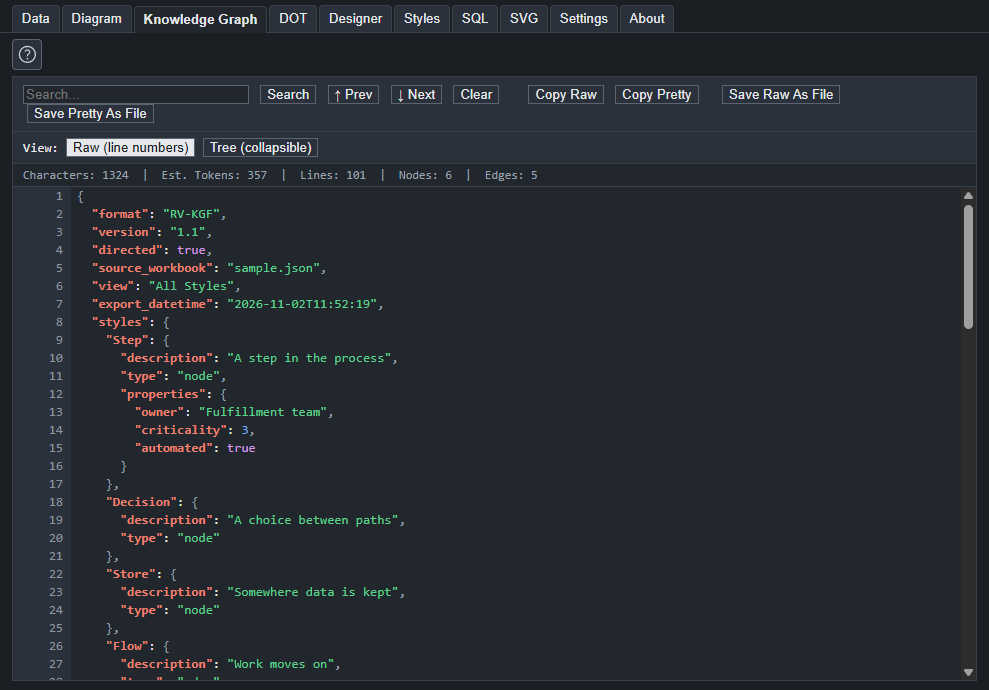
The viewer
The tab shows the Knowledge Graph for the view chosen in the left pane.
- Search finds text, with Prev and Next to step through the matches and Clear to start again.
- Raw shows the JSON as text with line numbers. Tree shows it as a tree you can open and close.
- Copy Raw and Copy Pretty put the text on the clipboard, compact or indented. Save Raw As File and Save Pretty As File write it to a file.
- A line of counts shows the characters, an estimate of how many tokens an AI tool will count, the lines, and the numbers of nodes and edges. The estimate is about four characters to a token, with eight percent on top. It is a guide to whether the file will fit in a request.
Anything that was left out, such as a row whose style is not used in the chosen view, is listed in the left pane under Knowledge Graph messages, with its row number.
What is in the file
json
{
  "format": "RV-KGF",
  "version": "1.1",
  "directed": true,
  "view": "All Styles",
  "styles": {
    "Step": {
      "description": "A step in the process",
      "type": "node",
      "properties": { "owner": "Fulfillment team", "criticality": 3, "automated": true }
    }
  },
  "nodes": [
    { "id": "Order received", "style": "Step", "label": { "value": "Order received", "type": "text" } }
  ],
  "edges": [
    { "id": "Order received->Credit check", "source": "Order received", "target": "Credit check", "style": "Flow" }
  ]
}styleslists each style in use, with its description, its type, and the properties set on the style.nodeshas one entry for each node, and one for each cluster, which says which cluster it is inside.edgeshas one entry for each edge, with its labels.- Properties from the Properties column of a row or a style are in a
propertiesobject, and keep their types. A bare number is a number,trueandfalseare booleans, and a quoted value is text. The properties of a style are listed with the style, and the properties of a node or an edge are its own. - The file says where it came from in
source_workbook, a name kept from the Excel tool that this app grew out of. It is the name of the project file, or the project name when the project is not saved yet. The time it was made is there too.
Where each part comes from
| In the file | It comes from |
|---|---|
a style's description | The Description of the style, on the Styles tab and in the Designer. |
a style's type | The Style Type of the style: node, edge, cluster and so on. |
a style's properties | The Properties of the style. |
a node's id, label and style | The Item, Label and Style Name of the row on the Data tab. |
an edge's source, target and style | The Item, Related Item and Style Name of the row. |
a node's or an edge's properties | The Properties of the row, which belong to that one node or edge. |
The format
The file follows the Relationship Visualizer Knowledge Graph Format (RV-KGF). Its schema and examples are published at github.com/jjlong150/rv-kgf, so a program that reads the file, or a prompt that describes it to an AI tool, can rely on a written definition and not on a guess. The format and version fields at the top of every file name it.
The Excel tool, Relationship Visualizer (also called Excel to Graphviz), writes the same format, so the two tools produce files that can be compared, and a file from either can be read by the same program.
Writing the file
Turn on the second Write button in the left pane, the one with the three joined dots, and press Publish. The file is a .json file beside the others. The Knowledge Graph layout setting chooses between a compact file and one indented by two or four spaces. The compact one is smallest, which matters for what an AI tool is given.
Publish will not write over the open project file, or over a .json file that is not a Knowledge Graph, so a name that clashes is refused and not replaced.
Properties are what make it useful
A diagram needs only names and links. A Knowledge Graph is worth more when each node and edge says what it is, who owns it, how critical it is, and so on. Add those as properties, on the style when everything of that kind shares them and on the row when it is particular, and the file carries them.
- A description on every style tells a reader what the kind of thing is. A person reading the file, or an AI tool you ask about it, has the words and not only the shape.
- Properties on the style hold what every thing of that kind shares:
owner="Finance",layer="database",criticality=3. - Properties on a row hold what is particular to one node or edge:
rpo_hours=4,last_reviewed="2026-09-30". - Type the value the way you want it read. A bare number is a number and
trueis a true/false value, so a program can add up and compare. Put a value in quotes to keep it as text.
The Designer has a small grid for a style's properties, and the Properties column of the Data and Styles tabs has the same pencil. Use the same names on every style and row, for the same kind of fact, so that the file can be searched and compared.