
Appearance
The SQL tab
The SQL tab builds the rows of the Data tab from queries, so a graph can come from data you already keep in a spreadsheet, a CSV file or a database file. Each line of the script is a command or a SELECT. Run SQL runs the lines in order and replaces the rows of the Data tab with what they produce, as one step that Undo puts back.
Where the data comes from
- Excel and LibreOffice workbooks (
.xlsxand.ods). Each worksheet is a table named after it, and its first row gives the column names. WriteFROM [Steps$]orFROM [Steps]. A workbook that ONLYOFFICE or LibreOffice saved as.xlsxis read like any other. - CSV and TSV files (
.csvand.tsv). Text with one record on each line, which is what Salesforce, ServiceNow and most reporting tools export. The file is one table, named after the file, and its first row gives the column names:FROM [orders]fororders.csv. - Access databases (
.mdband.accdb). Each table is a table, with its own column names:FROM [timeline]. Only the tables are read. Saved queries, linked tables and password-protected databases are not supported. - SQLite databases (
.sqliteand.sqlite3). Each table is a table, as the file has it. - Apple Numbers (
.numbers) files are not read. In Numbers, choose File, Export To and Excel (or CSV), and give the exported file to Graph Modeler. Each table of the Numbers document becomes a sheet of the workbook.
You do not need Excel to use any of these, so on Linux a LibreOffice spreadsheet, a workbook saved as .xlsx or a CSV file all work.
Queries run on SQLite and cannot change the file or any other file. A file name that is not complete is taken from the folder the project is saved in.
How a CSV file is read
A CSV file can come from any program on any system, so Graph Modeler works out how it was written.
- The characters. UTF-8, with or without a byte order mark; UTF-16, which is what Excel's "Unicode text" saves; or, when a file is not valid UTF-8, the Windows code page that older programs write.
- The delimiter. A comma, a semicolon (used where the decimal mark is a comma), a tab or a bar, found from the first lines of the file. A
.tsvfile is always cut at tabs. - The columns. A column in which every cell is a number holds numbers, so they can be added and compared. Any other column is text, so a code such as
00501keeps its leading zeros, and so does a number written with a decimal comma, such as10,5. An empty cell is empty, and a date is text, as written in the file.
A CSV file is one table, and a statement runs against one file, so a statement cannot join two CSV files. To join tables, keep them as sheets of one workbook or as tables in one database. A script can still use several CSV files, one on each line, and the rows the lines produce are put together on the Data tab.
Which file a line uses
The first of these that applies:
- The Data File on the line itself.
- The file named on the last
SET DATA FILEline above it. - The file chosen in the Data source list on the toolbar, in the folder chosen beside it.
- No file. The statement then has no tables, which is enough for
SELECT 'node' AS [Item].
Naming the file on each line is how one script puts several files together: the same query against Jan.xlsx and then Feb.xlsx, or some columns from one file and some from another.
Writing a query
Name the columns of the result after the columns of the Data tab, in any case and with or without spaces: Item, Label, External Label, Tail Label, Head Label, Tooltip, Related Item, Style Name and Attributes. Other columns are ignored.
sql
SELECT [Step] AS [Item], [Kind] AS [Style Name] FROM [Steps$]sql
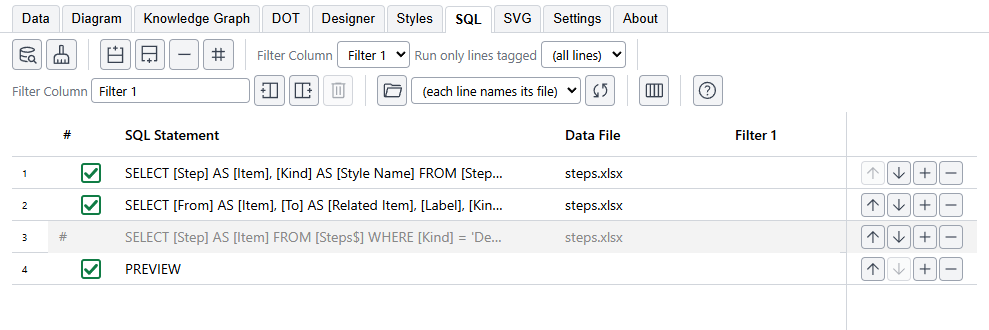
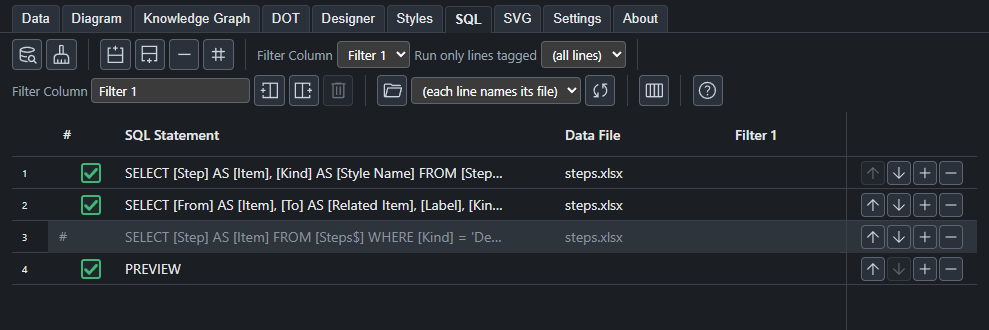
SELECT [From] AS [Item], [To] AS [Related Item], [Label], [Kind] AS [Style Name] FROM [Flows$]The two lines above, run against a workbook with a Steps sheet and a Flows sheet, make the graph in the screenshot: the first line makes the nodes and the second makes the edges. The rows come out in the order the lines are written.
Queries written for the Excel tool this app grew out of mostly run unchanged. & joins text, double quotes can hold a string, and the Jet functions Len, Mid, UCase, LCase, Nz, CLng, CInt, CDbl, CStr, IsNumeric, Left, Right and Switch are there. Some things Jet does and SQLite does not are not, such as Format and DateDiff, and the message of the line says so.
Writing a long statement
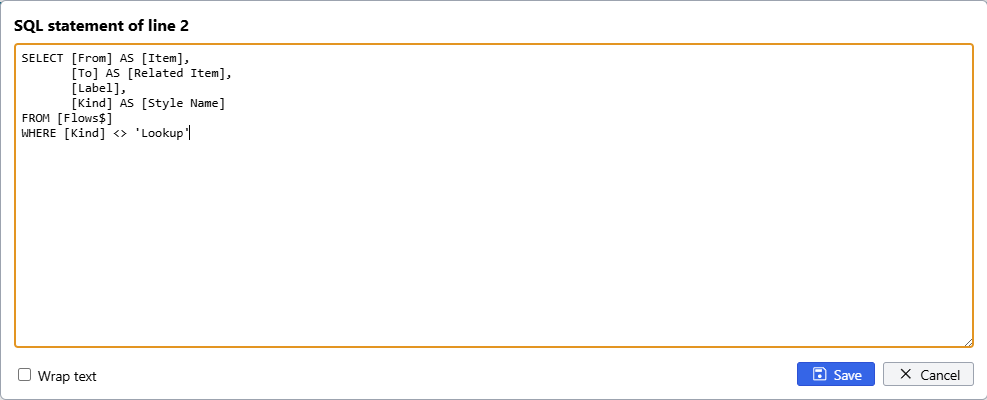
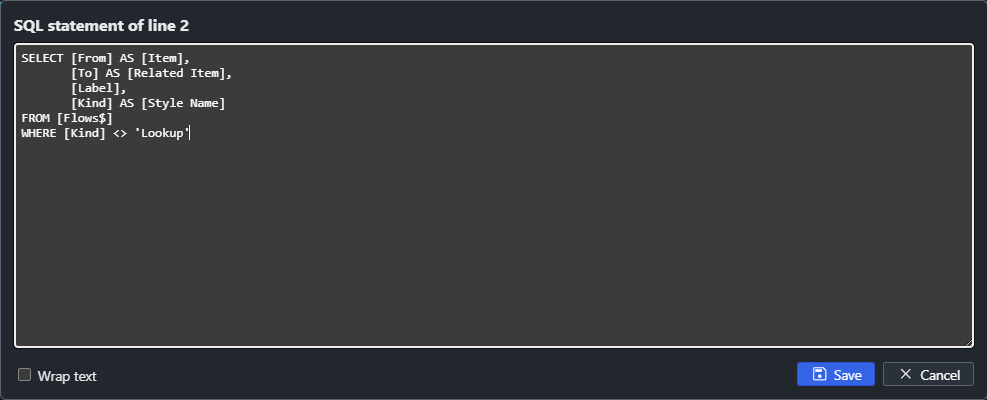
The grid shows each statement on one line, and cuts it short. The pencil in the SQL Statement cell opens a box with the whole statement, where it can run over several lines. Save keeps it and Cancel leaves it as it was, and Wrap text wraps long lines so they can be read without scrolling.
Commands
| Line | What it does |
|---|---|
RESET | Throws away the rows produced so far. |
SET DATA FILE | The line's Data File is used for the lines after it. |
SET PLACEHOLDER name = value | Puts value where {name} is written in the lines after it. |
SET CLUSTER LEVEL LIMIT = n | Limits how many levels of clusters a query makes. |
PUBLISH | Writes the files, as the Publish button does, with the rows produced so far. |
PREVIEW | After the script, draws the diagram and shows the Diagram tab. |
PREVIEW AS KNOWLEDGE GRAPH | After the script, shows the Knowledge Graph tab. |
PUBLISH
PUBLISH                                  the chosen view, as the Write buttons say
PUBLISH ALL VIEWS                        every view, as the Write buttons say
PUBLISH AS KNOWLEDGE GRAPH               the chosen view, the Knowledge Graph only
PUBLISH ALL VIEWS AS KNOWLEDGE GRAPH     every view, the Knowledge Graph only
PUBLISH AS UNDIRECTED GRAPH              the chosen view, drawn undirected for this publish
PUBLISH ALL VIEWS AS DIRECTED GRAPH Q3   every view, drawn directed, with the file name prefix Q3
A word or words at the end are the prefix of the file name, for this publish only. A script can publish, RESET, make other rows, and publish again. If a file name has a counter, each publish takes the next number, so no line overwrites another.
How each line went
A mark beside the # shows how a line ran, and fills in as the script goes:
- A green box with a check is a line that ran.
- A red box with a cross is a line that failed. Hover over it to read why. Every failure is also listed in the left pane, with its row number.
- A line that is commented out, or left out by the filter, has no mark.
A mark goes away when you edit its line, because nothing yet says whether the change put it right. The broom button takes every mark away. A line that is neither a SELECT nor a command fails, and its message lists the commands.
Filters
Each line can carry a tag in a filter column, and a script can have several filter columns. Choose a filter column and a tag on the toolbar, and only the lines with that tag run. The others are skipped. A project can have a column for each task it does, such as "weekly" and "audit", and one script holds them all.
Clusters, sequences and trees
Some result columns do more than fill a cell.
- Clusters.
ClusterandSubclustercolumns put rows into nested clusters, withCluster Label,Cluster Style Name,Cluster AttributesandCluster Tooltipto describe them.Cluster1,Cluster2and so on go deeper.{clc}and{scc}stand for the cluster and subcluster number, and{rsc}for a row's position in the results. Placeholders lists them all. ENUMERATErepeats a row for every number in a range (START AT,STOP AT,STEP BY), with{step}in any value.CREATE EDGESlinks consecutive rows into a chain.CREATE RANKcollects the items of a query into one line that tells Graphviz to align them.ITERATEruns one query for each ID that another query returns, for header and detail data.CONCATENATEjoins many detail rows into one value.TREE QUERYfollows a hierarchy stored as rows, such as an org chart or a route map, down from a starting row.
These come from the Excel tool, and a script that uses them runs here.