
Appearance
The Diagram tab
The Diagram tab draws the graph with Graphviz. The picture is redrawn as you change the data or the styles, and the buttons above it change how Graphviz lays it out, so you flip between choices until the picture is what you want.
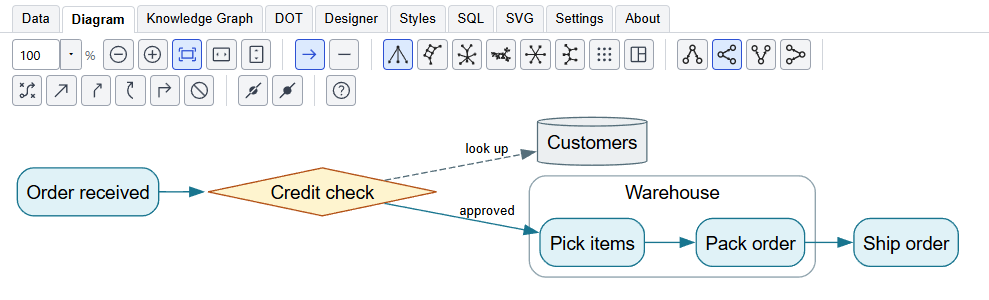
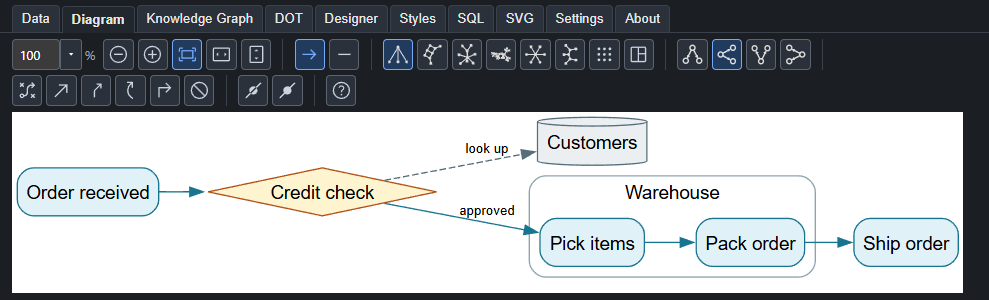
The diagram can also sit beside the data. The button with the split window on the Data tab shows or hides it there, and the same buttons are over the picture either way. The line between the data and the picture can be dragged to give either more room; see The Data tab.
The buttons
Hover over a button to read what it does. The ones you use most are first, and the ones you set once and leave are after them. From left to right:
| Group | Choices |
|---|---|
| Zoom | The box shows the magnification in percent. Type any whole number from 5 to 800, or choose one from its list. The minus and plus buttons step to the next value: by 5% up to 150%, by 25% up to 400%, and by 100% above that. The three buttons after them fit the whole picture in the window, to the width of the window, or to its height. While a fit is on, the box shows the magnification it comes to, and the minus and plus buttons start from it. |
| Graph type | Directed, with arrows, or undirected, without. |
| Layout engine | Graphviz has eight ways of placing nodes. dot puts them in ranks, which suits flows and hierarchies. neato, fdp and sfdp are spring models that pull connected nodes together, and sfdp is for large graphs. circo puts nodes on a circle. twopi puts them in rings around a center. osage lays out clusters, and patchwork draws a treemap. |
| Direction | Which way the ranks run: top to bottom, left to right, bottom to top or right to left. Only the dot engine uses this. |
| Edge routing | How edges run: smooth curves (spline), straight lines, polylines, curved arcs, right angles (ortho), or no edges drawn. |
| Output order | Nodes first draws the edges over the nodes. Edges first draws them under, which is what to choose when edges cross behind a node in a large graph. The other two orders Graphviz has, breadth first and depth first, are seldom wanted and are in Settings. |
For edge routing, direction and output order, pressing the button that is on again goes back to Graphviz's own choice. The same choices are in Settings, with the picture of the one in use beside each.
Drawing
The two buttons beside the split-window button on the Data tab decide when the picture is drawn. The one with the arrows going round draws after every change. Turn it off for a large graph that is slow to draw, and press the other one, which draws once, when you are ready. A picture that is out of date says so.
If Graphviz has something to say about the graph, such as a warning, it appears in the left pane under Graphviz messages. When Graphviz reports an error but still draws the graph, which the ortho edge routing can do when it loses an edge, the picture is shown with a red notice above it, because it may be incomplete. Choosing another edge routing or direction usually clears it. If Graphviz cannot draw the graph at all, the notice says so and quotes the error. Either way, the full messages are in the left pane. With Graphviz verbose messages on in the Troubleshooting part of Settings, Graphviz describes everything it does, which can be hundreds of lines, so the list scrolls.
Tooltips
A tooltip you give a node, an edge or a cluster is written into the DOT, and into every SVG you publish. Open the published file in a browser and the tooltip appears when the pointer rests on the item. The picture on this tab does not show them. It is displayed as an image, which is the way to show an SVG with a guarantee that no script in it can run, and a browser never shows tooltips for what is inside an image.
To see tooltips while you work, turn on SVG post-processing. The diagram is then shown as a live page, so its tooltips appear. Turn it on only for rules you trust; the SVG page says why. The Include Tooltip boxes in Settings decide whether tooltips are written at all.
Without Graphviz
This tab needs Graphviz. When it is not installed, the tab says so, with a link to download it and a button to look again. Close the message if you do not want to see it. Everything else in the app works without Graphviz, including the Data and Styles tabs, the Knowledge Graph and the DOT source.
Saving the picture
The diagram on screen is not a file. To write it, use Publish in the left pane. See Getting started.